How to Track Real Estate Market Trends With Realtor.com Data
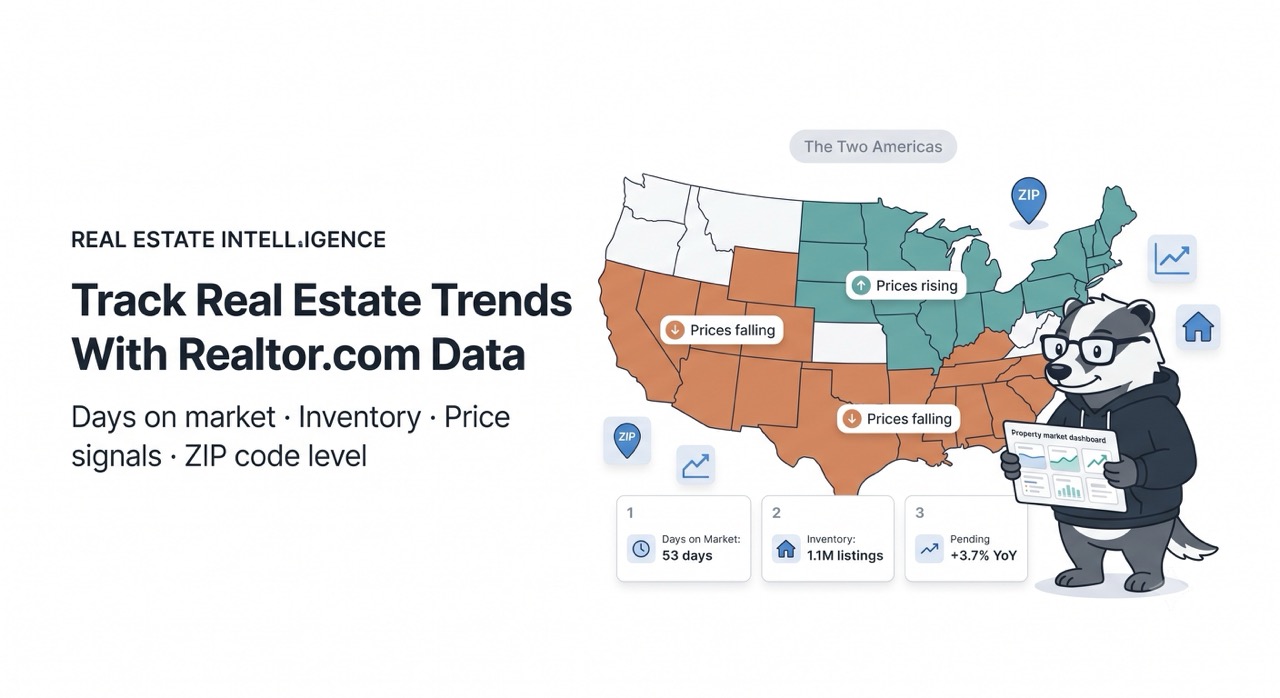
The national median list price on Realtor.com fell 2.5% year over year in June 2026 — the steepest annual drop since 2017 and the eighth consecutive month of price declines. Pending sales rose 3.7% for the seventh straight month. Inventory climbed to 1,102,615 active listings, up 1.9% from a year ago.
Eight straight months of falling prices. Seven straight months of rising pending sales. Both happening at the same time, on the same platform, in the same data release.
If those two figures sound contradictory, Danielle Hale, Realtor.com's chief economist, addressed it directly: "Eight straight months of falling prices and seven straight months of rising pending sales are not a contradiction. And they have to be considered together to get a full picture of what's happening in housing right now. Sellers are reading market conditions and are pricing accordingly from the start rather than listing high and cutting later, and buyers are taking note and making bids. This is a welcome sign that we are in a functioning market."
That nuance is the entire case for systematic Realtor.com data tracking. The national headline number — median price down 2.5% — describes a market that does not actually exist anywhere. It is the average of two wildly different regional stories: the West and South where prices have given ground significantly since the 2022 peak, and the Midwest and Northeast where inventory has stayed tight enough that prices kept climbing through a historic rate shock. As Jake Krimmel, Realtor.com's senior economist, put it: "The two Americas story in housing is now four years in the making."
The tools to understand which America you are operating in — and specifically which ZIP codes within it — live inside Realtor.com's listing data. This guide covers the signals that matter, how to read them, and how ScrapeBadger's Realtor.com Scraper gives you systematic access to them.
Why Realtor.com Is the Most Complete Public Market Data Source
Realtor.com occupies a distinctive position in the US real estate data ecosystem. Operated by Move, Inc., a News Corp subsidiary, the platform pulls listing data directly from over 800 MLS databases. This direct MLS connection means listings often appear on Realtor.com before they surface on platforms that rely on data syndication. For market tracking, that speed advantage matters: you are seeing the leading edge of supply changes rather than a lagged representation.
The platform also has no public API for market intelligence data. Zillow's API is deprecated. Realtor.com, Redfin, and Rightmove provide no open public endpoints for the kind of market intelligence data that real estate professionals and investors actually need. The St. Louis Fed does publish some Realtor.com-sourced aggregate statistics through FRED — median days on market by state and metro, for example — but these are monthly aggregates with a publication lag. They tell you what happened in markets nationally last month. They do not tell you what is happening in specific ZIP codes this week, or what the distribution looks like below the metro average, or whether the segment of the market you care about is moving differently from the headline.
Systematic scraping of Realtor.com listings at the ZIP code level is the only way to build that intelligence. The data it provides is public — every listing on Realtor.com is visible to any person with a browser — and the field set per listing is unusually rich.
What Realtor.com Data Contains per Listing
Each listing on Realtor.com carries a field set that feeds every major category of market analysis:
Core pricing fields: Current asking price, price per square foot, and price history as a time series of changes since the listing was first posted. The price history field — available on individual property detail pages via the platform's Next.js data blob — is one of the most commercially useful pieces of data in the market: it tells you not just where the price is, but how many times it has been reduced, by how much, and over what timeline.
Time on market: The number of days a listing has been active. Realtor.com uses a methodology updated in September 2022 that calculates time from list date to closing, pending, or off-market status, with improved handling of duplicate listings across MLSs.
Property specifications: Bedrooms, bathrooms, square footage (interior), lot size, year built, property type (single family, condo, townhouse, multi-family), and the amenity set.
Status fields: Active, pending, recently sold, and price reduced flags. The status field is the foundation of the most commercially valuable market signals.
Location data: Full address, latitude and longitude coordinates, school district information and ratings, and neighborhood data.
Agent and brokerage information: Listing agent name, agent ID, phone number, email address, and brokerage name.
Together, these fields support every significant real estate market analysis use case — from investor deal sourcing to brokerage competitive intelligence to prop-tech AVM training.
The Five Signals That Matter Most for Market Trend Tracking
Not all data fields carry equal intelligence value for market trend analysis. The five signals below are the ones that consistently produce actionable insight before the headline metrics catch up.
Signal 1: Days on Market Trend, Not Days on Market Level
The current national median of 53 days on market is identical to a year ago — ending, as Realtor.com noted, a streak of 26 consecutive months in which homes sold more slowly than the prior year. That national figure is useful context. It is not useful for market analysis.
What is useful is the trend in days on market for a specific geography and property type over time. Rising days on market — when you can track it ZIP by ZIP, week by week — signals weakening buyer urgency before any price pressure shows up in median price data. Median prices are slow-moving and subject to compositional effects (if cheaper homes are selling faster, the median can rise even when individual prices are falling). Days on market moves faster.
The June 2026 data shows exactly why the ZIP-level matters: time on market fell 8 days in Jacksonville, Florida, and 6 days in Richmond, Virginia — while it rose 6 days in Boston, Memphis, and Oklahoma City. The national number of 53 days describes none of these markets accurately.
For investors and market researchers, a rising days-on-market trend over a 30 to 60-day observation window in a target ZIP code is the earliest available signal of a market starting to soften. It appears in the listing data before price reductions are filed, before pending sales slow, and well before any published median price report captures it.
Signal 2: Price Reduction Frequency and Clustering
A listing with a price reduction is a data point. Fifty listings in the same ZIP code with price reductions within 30 days is a market signal. The distinction is scale — and scale is exactly what systematic scraping enables versus manual monitoring.
Price reduction frequency at the ZIP-code level surfaces demand weakness faster than any aggregate statistic. When a specific segment of the market — a price band, a property type, a school district — starts concentrating price cuts, it reveals that sellers are fighting to maintain interest in that particular pocket before the broader market shows the stress.
The fields that support this analysis are all present in Realtor.com's listing data: the current price, the price history array on detail pages, the listing date, and the listing status. Comparing current price against first-listed price, tracking the count of price changes per listing, and mapping the geographic distribution of price-reduced listings across ZIP codes produces the kind of hyper-local market intelligence that even professional data vendors rarely provide.
Realtor.com's June 2026 data showed that 33 of the top 50 metro areas were seeing per-square-foot price declines year over year. That is the macro signal. The ZIP-code distribution within those 33 metros — where specifically the cuts are concentrated, and in which property types — is what converts a market trend observation into an actionable investment thesis.
Signal 3: Inventory Velocity and New Listing Rate
National active inventory of 1,102,615 is 11.3% below typical 2017–2019 levels — a slight widening from the 10.4% gap recorded in May. The Northeast led inventory growth at +8.5% year over year. The Midwest added +7.3%. The South was essentially flat at -0.1%, and the West at +0.3%.
Inventory tracking at ZIP-code level gives you a signal more useful than the absolute count: the rate of new listing additions week over week. When new listing velocity accelerates in a specific ZIP code — more properties coming to market each week than the prior trailing period — it often precedes a softening in days on market and then in prices. Supply momentum leads price momentum by four to eight weeks in most normal market environments.
Measuring listing velocity requires time-series data. A single snapshot of Realtor.com listings shows inventory at a moment. Weekly snapshots of the same search query show how that inventory is growing, shrinking, or rotating. The difference between 120 active listings last week and 147 active listings this week in the same ZIP code is a signal. Running this measurement across hundreds of ZIP codes simultaneously is what converts a monitoring task into a competitive intelligence operation.
Signal 4: Delisting Rate and Relist Activity
Properties that are withdrawn from the market before selling are a behavioural signal about seller conviction that most market monitoring misses entirely. Delistings are not just an inventory footnote. They are a behavioral signal about seller conviction.
A high delisting rate in a specific area suggests sellers are testing the market, not finding buyers at their price, and withdrawing rather than reducing. It can precede an inventory shortage (if sellers hold and wait) or a price correction (if they relist at lower prices after a withdrawal period).
Relist activity — properties returning to active status after being withdrawn — indicates sellers resetting expectations rather than exiting permanently. A property that delisted at $650,000 in March and relisted at $590,000 in June tells a specific story about that seller's negotiating position that aggregate data cannot capture.
Realtor.com's listing status field captures active, pending, and off-market status. Tracking status transitions for the same property ID over time — which requires storing historical observations rather than just current snapshots — is what builds the delisting and relist signal.
Signal 5: Pending Sales Conversion Rate
Pending listings are properties that have accepted offers but not yet closed. The ratio of pending listings to active listings in a geography at a given time is the most forward-looking supply-demand signal available from public listing data.
A market with 200 active listings and 80 pending has a 40% conversion rate — a strong buyer market where a high proportion of what is available is under contract. A market with 200 active listings and 12 pending has a 6% conversion rate — a buyer's market where supply significantly exceeds current demand.
Tracking this ratio weekly at the ZIP-code level, combined with the days-on-market trend, gives you a leading indicator of where market momentum is changing. Louisville, Kentucky saw inventory up 28.7% year over year in June 2026. Buffalo, New York was up 27.7%. Seattle was up 20.6%. The pending conversion rate in each of those markets tells you whether the inventory build is being absorbed by increasing buyer activity or accumulating as unsold supply — two very different market conditions that require different responses.
The ZIP Code Level Is Where the Intelligence Lives
The regional divergence in the June 2026 Realtor.com data is stark: prices down 7.3% in the West since the 2022 peak while the Northeast is up 12.6%. Among the top 50 metros, prices are down in 28 and up in 22 since June 2022. The national median list price fell from $449,000 at the June 2022 peak to $430,000 today — a 4.2% drop at the national level that conceals two completely different market realities.
But even the metro level conceals important variation. A metro that shows flat median prices may have a hot inner ring where everything is going under contract in under two weeks while the exurban inventory is sitting for 90 days and accumulating price cuts. The investment thesis in the inner ring and the investment thesis in the exurbs are not just different — they are opposite.
ZIP-code level tracking is where the actionable intelligence diverges from the published reports. Monthly aggregate reports tell you what happened. ZIP-code level data tracking tells you what is happening — in the specific geographies where you have capital, clients, or inventory.
How Different Audiences Use Realtor.com Market Data
Real Estate Investors
Investors use the five signals above to identify when a specific market is shifting from seller-favoured to buyer-favoured before that shift is priced in. A ZIP code showing rising days on market, increasing price reduction frequency, and declining pending conversion rate is a market moving toward buyers — typically six to twelve weeks before median prices in that market start to decline.
The most commercially specific investor use case is the below-trend listing: a property priced materially below the comparable price-per-square-foot for its ZIP code and property type. Identifying these requires knowing the trend — the median and distribution of price-per-sqft in a geography — which requires aggregating data from all active listings, not just looking at individual properties. That aggregation is only possible at scale through systematic data collection.
Mortgage Lenders and Fintech
Days on market and inventory levels feed directly into collateral valuation risk models. A market with rapidly rising inventory and lengthening time on market is a market where collateral values are under pressure — information that is relevant to underwriting decisions before any closed-sale data reflects it.
Combining Realtor.com listing data with Google Trends search interest for mortgage and home buying terms in the same geography creates a two-signal demand indicator: what buyers are searching for on Google and what is actually available on Realtor.com at the same time.
Real Estate Agents and Brokerages
For agents, the highest-value use cases from Realtor.com data are ones that generate client opportunities before those clients have listed with a competitor.
Properties with long days on market and multiple price reductions are candidates for expired listings outreach — sellers who have been unable to find a buyer and may be receptive to a new agent conversation. These are the highest-converting categories of real estate leads, because the seller has already committed to selling and is actively frustrated with the current outcome.
Relisted properties — those that were withdrawn and have come back to market — represent sellers who tried to exit the market, waited, and are trying again. They typically have adjusted expectations and are motivated to transact.
Both signals are detectable from Realtor.com listing data. Neither is available without systematic tracking over time.
Proptech and Data Companies
For companies building automated valuation models (AVMs), Realtor.com listing data is a primary training input. The most accurate AVMs use active listing data as a real-time comparable, not just closed-sale records. A property that closed at $620,000 in January matters less for today's valuation than knowing that the three most similar properties in the same ZIP code are currently listed at $590,000, $605,000, and $625,000, and that two of them have been sitting for 45 days with one price reduction each.
Investment teams pull listings for comparable-property analyses and AVM training. Brokerages chase lead generation, spotting expired or relisted properties before competitors. Market researchers track inventory and price trends ZIP by ZIP. The common thread: you need structured, fresh data across thousands of listings.
Combining Realtor.com With Complementary Data Sources
Realtor.com listing data is most powerful when combined with complementary signals that provide context the listing data alone cannot supply.
Google Trends for search demand — ScrapeBadger's Google Trends API returns search interest over time for any keyword and geography. Combining search interest for terms like "homes for sale in [city]" with Realtor.com inventory levels in the same geography gives you a demand-supply balance indicator: are buyers looking but not finding, or is supply growing while demand stays flat?
Google Maps for neighbourhood intelligence — ScrapeBadger's Google Maps API returns business density, review scores, and category distribution for any geography. The commercial activity profile of a neighbourhood — restaurants, schools, transit, walkable amenities — is a long-run price determinant that listing data does not directly contain.
Google News for market event context — A Realtor.com signal showing inventory spiking in a specific metro is more interpretable when combined with Google News monitoring for that metro. Is the inventory spike caused by job losses at a major local employer? A new development coming online? A major employer announcing relocation into the area that will drive demand? News context converts a data anomaly into an actionable market read.
Reddit community sentiment — ScrapeBadger's Reddit Scraper surfaces community-level sentiment about specific cities and neighbourhoods in a way that no structured data source replicates. Real residents discussing their neighbourhood's trajectory in local subreddits are providing leading-edge qualitative data that precedes any listing-level quantitative signal.
All of these data sources run under one ScrapeBadger API key with unified billing and the same credit pricing model — no subscription required, credits never expire, no charge for failed requests.
The Technical Challenge: Why Realtor.com Is Hard to Scrape
Realtor.com runs PerimeterX's anti-bot system with biometric behavioural checks — one of the most sophisticated anti-bot configurations deployed on any real estate platform. As covered in the ScrapeBadger PerimeterX bypass guide, PerimeterX's detection operates through a behavioural biometrics layer that analyses mouse movement trajectories, scroll patterns, and timing signals — not just IP reputation and TLS fingerprinting. A scraper can pass every static fingerprint check and still be blocked by the behavioural layer.
The platform also renders its listing data through React with a Next.js frontend. Key data fields — including price history, detailed property specifications, and agent contact information — live in a __NEXT_DATA__ JSON blob embedded in the page rather than in HTML elements. Scrapers that return HTML without executing JavaScript miss these fields entirely and produce partial datasets that look structurally correct but are missing the most analytically valuable information.
Three specific failure modes account for the majority of Realtor.com scraping failures: returning a CAPTCHA page that came back with HTTP 200 status (a silent block that looks like success), selector drift when Realtor.com's React build regenerates hashed class names on a new deployment, and hitting PerimeterX's behavioural checks on requests that passed static fingerprinting.
ScrapeBadger's Realtor.com Scraper handles all three layers — PerimeterX's biometric checks through browser-level automation with stealth patching, JavaScript rendering through headless Chrome execution, and content validation before billing to ensure you are not paying for CAPTCHA pages or empty responses. The full field set — including price history, agent contacts, and latitude/longitude — is returned as structured JSON without HTML parsing.
Who Builds on Realtor.com Data
The audience for systematic Realtor.com data access is specific and commercially well-defined:
Prop-tech companies building market intelligence products, AVM tools, neighbourhood analysis platforms, or investment research tools. For these companies, Realtor.com data is a core input rather than a supplementary check. The reliability and completeness of the scraping infrastructure is directly connected to product quality.
Investment firms and family offices doing residential real estate research at scale. Quantitative approaches to residential real estate — screening markets by the five signals above, building systematic buy/sell frameworks based on trend indicators — require data infrastructure that manual processes cannot support.
Real estate agencies and brokerages building data-driven lead generation systems. The expired listing and price-reduction clustering use cases described above scale directly with the ability to run systematic, high-frequency Realtor.com collection across a large geography.
Mortgage lenders and servicers incorporating real-time listing market signals into collateral valuation and risk management workflows.
Market research firms providing housing market analysis to institutional clients who need local market intelligence faster than monthly aggregate reports can provide it.
For all of these audiences, the data need is the same: structured, fresh, complete Realtor.com listing data at ZIP-code granularity, updated on a schedule that matches the pace at which the market is moving. Free trial at scrapebadger.com/realtor-scraper — 1,000 credits, no credit card required.
FAQ
Does Realtor.com have a public API for listing data?
No. Realtor.com has no public API for listing search or market intelligence data. The platform's direct API access is available only to licensed MLS partners under commercial agreements. For developers and data teams needing programmatic access to Realtor.com listing data, scraping is the only available path.
What makes Realtor.com different from Zillow for market data?
Realtor.com pulls data directly from 800+ MLS databases rather than receiving it via syndication, which means listings appear faster — often before they show up on competing platforms. Realtor.com is also the source used by the Federal Reserve's FRED database for housing market statistics. Zillow provides its Zestimate valuation alongside listing data, which Realtor.com does not match with a comparable metric, but Realtor.com's MLS-direct connection gives it a timeliness advantage for active listing monitoring.
How frequently should you scrape Realtor.com for market trend tracking?
It depends on the use case. For investment deal sourcing and expired listing lead generation, daily collection is appropriate — listing status changes, new price reductions, and new listings all happen continuously. For market trend analysis and aggregate indicator calculation, weekly snapshots are sufficient to observe the signals described in this article. Monthly snapshots miss meaningful intra-month variation in markets that are actively changing. According to research on listing data collection, active listings require weekly or daily refreshes to capture new properties and status changes.
Is scraping Realtor.com legal?
Collecting publicly visible listing data from Realtor.com is generally defensible under the hiQ v. LinkedIn precedent that scraping publicly accessible web data does not violate the CFAA. Realtor.com's Terms of Service prohibit automated access — a contractual restriction rather than a criminal one. Agent names, phone numbers, and email addresses should be treated as personal data under CCPA and analogous regulations; collecting them for resale or unsolicited outreach carries additional legal risk. For internal research, market analysis, and AVM training, publicly visible listing data is widely used by practitioners.
What is the biggest mistake teams make when building Realtor.com data pipelines?
Treating a single price snapshot as market intelligence. A listing at $595,000 tells you very little. A listing at $595,000 that was originally listed at $650,000 three months ago, has had two price reductions, and has been sitting 87 days longer than the median for its ZIP code tells you a great deal about seller motivation, market absorption, and where the price is likely to go next. Time-series data — storing observations regularly and comparing current state against prior observations — is what converts Realtor.com data from a lookup tool into a market intelligence system.

Written by
Domas Sakavickas
Domas Sakavickas is the Co-founder of ScrapeBadger, building web scraping infrastructure for developers and data teams. He writes about the web data market, tool comparisons, business use cases for scraping, and what it takes to turn public web data into a competitive advantage.
Ready to get started?
Join thousands of developers using ScrapeBadger for their data needs.