Amazon Price Intelligence: How to Monitor 10,000 SKUs Without Breaking the Bank
Here is the math that breaks most Amazon price monitoring pipelines before they get started.
10,000 SKUs. Product detail endpoint. Once per day. That is 100,000 API credits daily — roughly 3 million per month. Push the check frequency to every four hours, which is what competitive categories actually require, and you are at 12 million credits per month. Add offers checking on your top products for Buy Box intelligence and the number climbs again.
The teams that discover this math after building their monitoring system fall into one of three groups. The first group slashes the SKU list to a manageable number and loses visibility on their long tail. The second group accepts the cost and builds infrastructure they cannot explain to a finance team. The third group — the one this article is written for — builds a tiered architecture that applies the right monitoring intensity to each product based on what that product actually needs, at a total cost a fraction of the naive approach.
Successful sellers who implement strategic price monitoring can achieve significant competitive advantages — up to 8% profit increases through strategic pricing adjustments while maintaining market competitiveness. That ROI case requires the monitoring to exist. The question is building it without the cost making the economics indefensible.
Why the Naive Approach Fails at Scale
Most price monitoring implementations make the same three architectural mistakes. They are individually forgivable. Combined, they produce a system that costs far more than it should and delivers intelligence that is simultaneously excessive on products that do not need it and insufficient on products that do.
Mistake 1: Treating All SKUs as Equal Priority
Your top 200 revenue-generating ASINs are not the same monitoring problem as your 2,000 slow-moving long tail items. They should not be checked at the same frequency, using the same endpoint, with the same alert thresholds.
In sports and outdoors today — pulled from live Amazon data — the top BSR positions show exactly why some products need intraday monitoring while others do not. Owala FreeSip water bottles hold BSR positions 3 and 4 simultaneously: the 40oz version at $35.99 with 8,198 ratings and the 24oz at $23.99 with 115,319 ratings. Two products from the same brand, adjacent BSR ranks, competing directly in the same category. A seller competing in water bottles needs to know within hours when either Owala product reprices or runs a promotion — because both products are actively shaping the price expectations of buyers evaluating the entire category.
Meanwhile, BSR #22 is a braided fishing line from Reaction Tackle at $11.98 with 25,508 ratings. That product's price has almost certainly not moved in weeks. Checking it four times daily returns the same data four times while consuming the same credits as checking a volatile consumer electronics listing.
Mistake 2: Using the Highest-Cost Endpoint for Every Check
ScrapeBadger's Amazon product detail endpoint costs 10 credits and returns the complete data model: title, pricing, BSR, all review data, A+ content, variants, frequently bought together, buybox owner, fulfillment type, and more. For a check whose sole purpose is detecting whether the price changed since the last observation, nine of those ten credits bought information that will never be read.
The search endpoint returns pricing data for up to 20 products in a single 5-credit call — 0.25 credits per product versus 10 for individual detail calls. For long-tail monitoring where you only need to know if a price shifted significantly, that is a 40x cost reduction per product checked.
The offers endpoint at 8 credits is worth its cost specifically when you need competitive offer intelligence — who owns the Buy Box, what other sellers are offering, what fulfillment method is winning. It is not worth running on every ASIN every cycle when most of your catalogue has stable single-seller dynamics.
Mistake 3: Ignoring the Deals Endpoint as a Free Alert System
Amazon's deals endpoint returns all current lightning deals and promotional products across a category at 5 credits per call — regardless of how many deals it returns. Running it hourly across your product categories costs approximately 120 credits per day.
In exchange, you get real-time visibility into every competitor actively running a promotion in your category, right now. A competitor running a 35% off lightning deal on a product competing directly with your listing is the most urgent pricing intelligence your system can generate. The deals endpoint surfaces it automatically without you needing to poll that specific ASIN.
This is the layer most monitoring systems are missing. Teams building product-by-product polling infrastructure are paying 40x more per alert than they need to for the most time-sensitive signal.
The Tiering Framework: Right Endpoint, Right Frequency, Right Product
The efficient architecture divides 10,000 SKUs into three monitoring tiers based on revenue contribution, competitive intensity, and price volatility history. Tier membership is not permanent — it should be recalculated quarterly as your product mix evolves.
Tier 1: Intraday Full Intelligence (Top 200 ASINs)
These are your highest-revenue, most competitively contested products. They warrant the most thorough and frequent monitoring because repricing events here have the largest immediate impact on revenue and margin.
What earns Tier 1 placement: Top 200 by revenue contribution. Active Buy Box competition (three or more competing offers). Price change history showing more than five moves in the past 30 days. Category position in the BSR top 5,000 where competition is most active.
Check frequency: Every two to four hours during business hours (6am–10pm in the marketplace's primary timezone), every six hours overnight. The intraday window matters because competitor repricing in active categories follows human business hours — most repricing happens during business hours when sellers or their repricing tools are actively monitoring.
Endpoints per cycle: Product detail (10 credits) plus offers (8 credits) = 18 credits per cycle. The offers endpoint is what makes this tier genuinely useful rather than expensive price tracking — it tells you exactly who owns the Buy Box, at what price, with what fulfillment method, and how your current offer compares to the winning configuration.
Daily credit cost per ASIN: 18 credits × 8 check cycles = 144 credits per ASIN per day.
Total Tier 1 cost: 200 ASINs × 144 = 28,800 credits per day.
What you know: Complete competitive picture on your 200 most important products, updated throughout the trading day. You learn about Buy Box shifts within hours. New sellers entering a product appear in the next cycle. A competitor's price drop below your current position triggers within the check window.
Tier 2: Daily Product Intelligence (Next 1,000 ASINs)
Mid-range products generating meaningful but not top-tier revenue. Price changes here matter for margin management and competitive positioning but rarely require same-day response. A daily observation is sufficient for most decision-making workflows this tier feeds.
What earns Tier 2 placement: Revenue rank 201–1,200. Moderate competitive intensity (two to four competing offers). Price change history of one to five moves in the past 30 days.
Check frequency: Once daily, during off-peak hours (2am–6am marketplace time, when server load is lowest and response times are best).
Endpoints per cycle: Product detail only (10 credits). The offers endpoint is not run on this tier in regular cycles — it is triggered on-demand when the daily product detail check detects a price change above a configurable threshold (typically 3–5%). When that threshold is crossed, the system automatically runs an offers check on that ASIN to get the full competitive picture before generating an alert.
Daily credit cost per ASIN: 10 credits × 1 cycle = 10 credits per ASIN per day.
Total Tier 2 cost: 1,000 ASINs × 10 = 10,000 credits per day.
What you know: Daily price snapshots for your mid-range catalogue, with on-demand competitive depth automatically available when meaningful changes are detected. Over a month of observations, you also build the price history and change frequency data that will inform the next quarterly tier reclassification.
Tier 3: Batch Search Monitoring (Remaining 8,800 ASINs)
Long-tail products with stable pricing and low competitive intensity. These need to be in the monitoring system — a competitor suddenly pricing below you on a previously quiet ASIN is worth knowing about — but individual ASIN-level endpoint calls are wasteful at this scale and frequency.
The batch search approach: Rather than calling the product detail endpoint per ASIN, this tier monitors through category-level search calls that return pricing data for 20 products per 5-credit call. By searching for the product keywords and category terms your long-tail ASINs appear under, you surface price intelligence across multiple products in a single call. When a search result shows a significant price change on an ASIN in your watchlist, it triggers an individual detail call for confirmation and alert generation.
Check frequency: Every three days per ASIN. Running the search calls for 8,800 ASINs (440 search calls) spread over three days means approximately 147 search credits per day for the entire long tail.
Endpoints used: Category and keyword search (5 credits, 20 results). Individual product detail (10 credits) triggered only on change detection.
Daily credit cost for entire Tier 3: Approximately 150 credits per day for 8,800 ASINs — roughly 0.017 credits per ASIN per day.
Total Tier 3 cost: ~150 credits per day.
The Deal Alert Layer
Running ScrapeBadger's deals endpoint hourly across your product categories costs approximately 120 credits per day. It covers all tiers simultaneously and catches promotions before the product-level polling cycles would detect them.
When a deal alert fires on an ASIN in your watchlist: Escalate it to an immediate Tier 1 check regardless of its normal tier assignment. A Tier 3 long-tail product suddenly appearing in a lightning deal warrants the same urgency as a Tier 1 repricing event.
When a deal alert fires on an ASIN not in your watchlist: Add it to a "competitive deal watch" log. A product in your category you had not been monitoring is now actively being promoted at a discount — that changes your competitive context even if it is not a product you directly compete with.
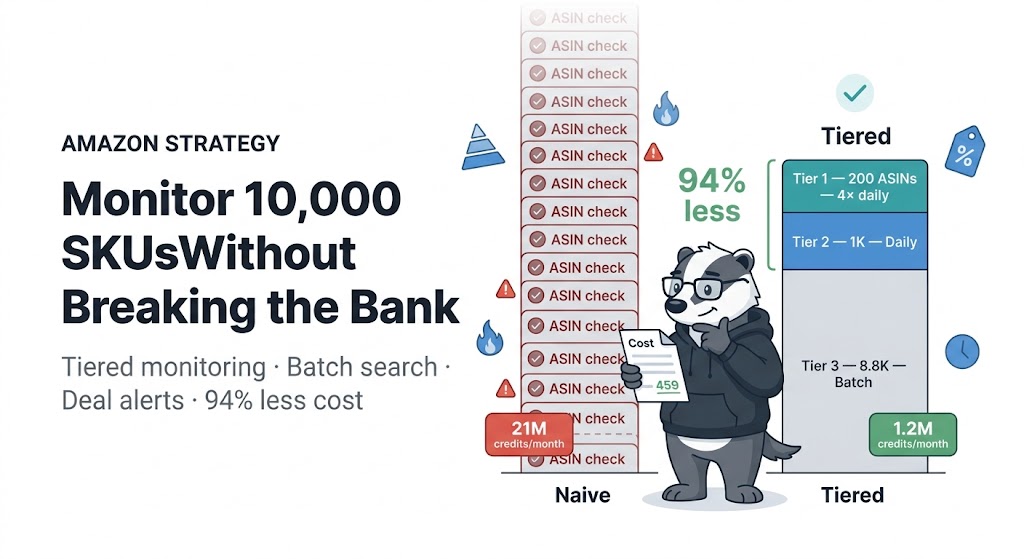
The Full Cost Picture
Architecture | Daily Credits | Monthly Credits | What You Get |
|---|---|---|---|
Naive: all SKUs, detail + offers, 4× daily | 720,000 | 21,600,000 | Uniform coverage, massive waste |
Naive: all SKUs, detail only, 1× daily | 100,000 | 3,000,000 | Daily price snapshots, no Buy Box |
Tiered with deal alerts | ~39,000 | ~1,170,000 | Intraday intelligence where it matters |
The tiered architecture delivers better intelligence on your most important products than naive daily monitoring — because Tier 1 checks every two to four hours rather than once daily — while using 39% of the credits of naive daily checking and 5% of the credits of naive four-hourly checking.
The savings compound with ScrapeBadger's zero-credit-for-failed-requests policy. On a 10,000-ASIN monitoring system running daily, even a 5% failure rate on a system that charges for failures adds 500 wasted credits daily — 15,000 per month. On ScrapeBadger, those failures cost nothing. The credit budget you modelled is the credit budget you spend, without adjustment for failure rate.
Building the Tier Classification System
The tiering framework requires classifying and periodically reclassifying your ASIN list. The inputs are:
Revenue data (internal): Your own sales records provide the revenue ranking. No scraping needed here — you already have this data. Sort your ASIN list by trailing 90-day revenue and the top 200 go to Tier 1, the next 1,000 to Tier 2.
Competitive intensity (from ScrapeBadger offers endpoint): Run a one-time offers check on your full ASIN list. Products with three or more competing offers showing Buy Box rotation should be elevated within their tier or to the next tier up.
Price volatility history (from ScrapeBadger product detail, first 30 days): During the first month of running your monitoring system, record every price change observation per ASIN. After 30 days, sort by change frequency. High-frequency ASINs get tier elevation; stable ones get deprioritised.
Quarterly review: Run the classification logic again with updated revenue data and a fresh volatility window. ASINs that have become more competitive move up; those that have stabilised move down. The system self-optimises over time.
Practical Alert Architecture
The monitoring data is only valuable if it feeds decisions. The alert architecture that works in practice has three layers.
Immediate alerts (Tier 1 only): Price changes above 5%, Buy Box ownership changes, new competitors entering a product, and deal alerts on any watched ASIN. These fire in real time via Slack or webhook to the pricing team. Response expectation is same-hour.
Daily digest (Tier 1 and 2): All price changes detected in the last 24 hours, BSR movements above a threshold, and a summary of competitive activity across categories. This goes to the broader merchandise and marketing team for context without flooding them with intraday noise.
Weekly intelligence report (all tiers): Catalogue-level view of which categories are seeing increased price competition, which ASINs have had new competitors enter, what promotions ran in the past week. This feeds strategic decisions rather than operational responses.
The ScrapeBadger Amazon price tracker tutorial on the blog covers the full change detection and alert delivery pipeline with working Python code — the architecture described above is exactly what that pipeline implements.
What the Sports Category Data Tells You
The live Sports & Outdoors bestseller data pulled for this article illustrates the tiering logic in practice.
Owala FreeSip at BSR #3 and #4 represents Tier 1 territory for any water bottle seller — high velocity, strong brand momentum, and direct competition between two SKUs from the same brand at different price points creates active pricing dynamics. A third-party seller in the water bottle category would want intraday monitoring on both.
Amazon Basics Neoprene Dumbbells at BSR #2 with 127,157 ratings and a $9.77 price point is a completely different monitoring problem. Amazon's own product at that price and review count is essentially immovable from a competitive standpoint. A competing dumbbell seller would still want to track it for market context, but checking it four times daily is wasteful — it belongs in Tier 2 at most.
The jump rope (BSR #25, $8.99) and resistance bands (BSR #23, $9.98) with 24,652 and 135,646 ratings respectively are classic Tier 3 candidates. Stable price points in a category with high review counts indicating mature market dynamics. They belong in the monitoring system for long-tail visibility but need nothing more than batch search coverage every few days.
Recognising which category of monitoring each product needs — and building the infrastructure to apply that recognition systematically — is the difference between an Amazon intelligence operation that costs $X and one that costs $4X for the same business value.
ScrapeBadger's Amazon Scraper provides all 14 endpoints the tiered architecture requires. Full endpoint documentation including exact credit costs at docs.scrapebadger.com/amazon/overview. Free trial at scrapebadger.com/amazon-scraper — 1,000 credits, no credit card.

Written by
Domas Sakavickas
Domas Sakavickas is the Co-founder of ScrapeBadger, building web scraping infrastructure for developers and data teams. He writes about the web data market, tool comparisons, business use cases for scraping, and what it takes to turn public web data into a competitive advantage.
Ready to get started?
Join thousands of developers using ScrapeBadger for their data needs.