Does Google Trends Have an API? What to Use in 2026
 Domas Sakavickas
AI Summary: Yes, but barely. Google announced an official Google Trends API on July 24, 2025. Nearly a year on it is still an application-gated alpha, so most developers cannot get in. pytrends, the long-standing Python library, was archived on April 17, 2025 and is unmaintained. Trends returns relative interest scored 0-100 against the peak in your chosen range and region, not search volume. Practical 2026 options are maintained third-party APIs or community forks like trendspyg.
Yes. Sort of. And that "sort of" is why you ended up here.
Google announced an official Google Trends API on 24 July 2025. It is real, it comes from Google, and it does what you would want it to do. It is also still an application-gated alpha almost a year later, which means you apply, you join a queue, and most people never get in. So for the overwhelming majority of developers asking this question in 2026, the practical answer is still no, you cannot just go and get an API key.
Then there is the other thing nobody told you. pytrends, the library every tutorial and Stack Overflow answer points at, was archived on 17 April 2025. It is read-only. Nobody is fixing it.
So the honest state of play is that an official API exists but you probably cannot use it, and the unofficial workaround everyone recommends is no longer maintained. That is an annoying answer, but it is the true one, and the rest of this post is about what you actually do with it.
AI Overview
Yes, but barely. Google announced an official Google Trends API on July 24, 2025. Nearly a year on it is still an application-gated alpha, so most developers cannot get in. pytrends, the long-standing Python library, was archived on April 17, 2025 and is unmaintained. Trends returns relative interest scored 0-100 against the peak in your chosen range and region, not search volume. Practical 2026 options are maintained third-party APIs or community forks like trendspyg.
The official API, and why you probably do not have it
Daniel Waisberg and Hadas Jacobi announced it at Search Central Live APAC and Google published the details on the Search Central blog the same day. You can read Google's own announcement directly, which I would recommend over anyone's summary of it.
The product itself sounds good. Consistently scaled data, so numbers you pulled last month still line up with numbers you pull today. A rolling five year window. Aggregation by day, week, month or year, so you pick the granularity instead of accepting whatever the interface gives you. Region and subregion breakdowns following ISO 3166-2. Data freshness in the region of forty-eight hours.
That consistent scaling deserves a moment because it is the genuinely useful part. If you have ever built a Trends chart, come back six weeks later, re-pulled the same query and found the shape had shifted, you know why it matters. The API is designed so you do not have to rebuild historical charts every time you add a new topic.
Here is the catch, and it is the whole thing. Google said at launch that access would open on a rolling basis to a limited number of developers, and that it would ramp up over the coming months. Nearly a year later it is still an alpha, still allowlisted, still an application form. Some people got in. Most did not. There is no self-serve signup, no billing page, no "generate API key" button. If you are building something on a deadline, an application queue with no published timeline is not a plan.
You should still apply, because applying costs you fifteen minutes and the situation may change. Just do not architect anything around it while you wait.
What Google Trends data actually is
This is the section I would keep if I had to throw away the rest of the post, because it is where most people go wrong and almost nobody explains it properly.
Google Trends does not give you search volume. It never has. It gives you relative interest on a scale of 0 to 100, and that scale is normalised to the highest point in whatever time range and region you selected.
Read that again, because the consequences are bigger than they look.
That 100 does not mean "a hundred thousand searches" or any other absolute number. It means "this is the busiest moment in the window you asked for." If you query the last twelve months, 100 is the peak of those twelve months. If you query the last five years, 100 is the peak of those five years, and your twelve-month peak might now show up as a 40. Same keyword. Same underlying reality. Completely different numbers, because you changed the window.
The same applies to geography. A term can hit 100 in Lithuania and 12 in the United States, and that tells you nothing whatsoever about which country does more searching. It tells you the term is relatively more prominent within Lithuanian search traffic. Small country, small absolute numbers, high relative interest. People misread this constantly and draw conclusions that are exactly backwards.
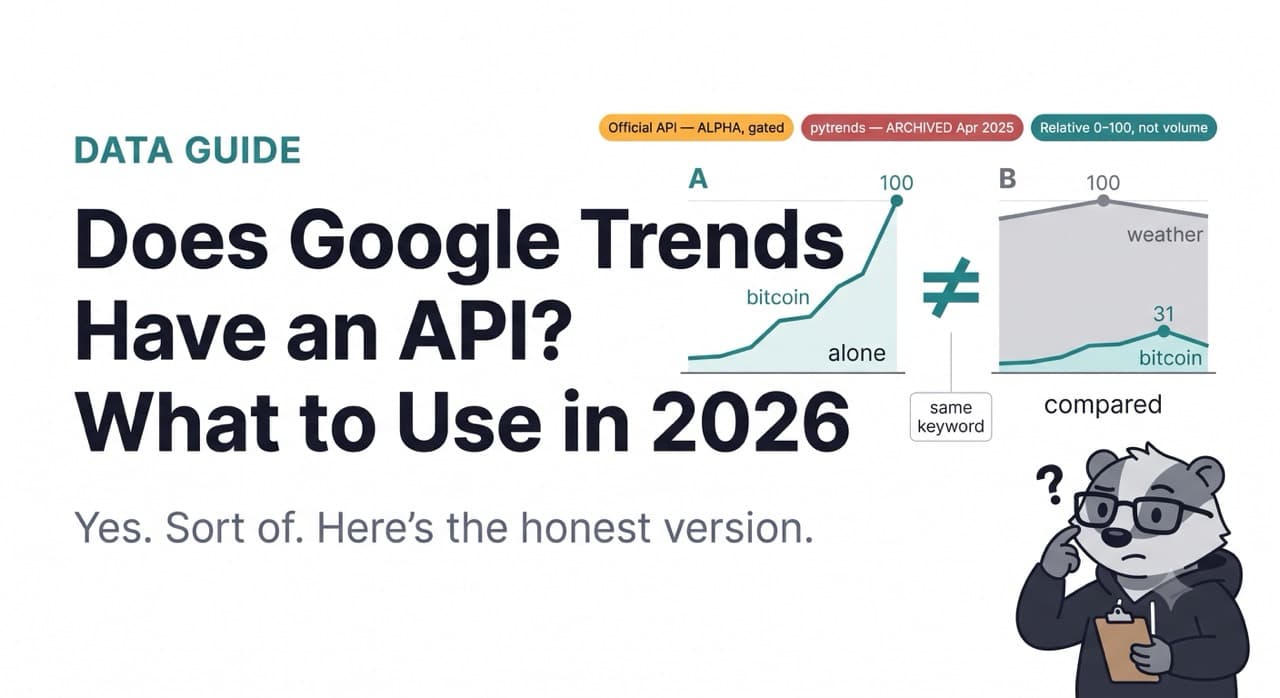
Now the part that really catches people out. When you put two or more terms in a single Trends query, they are normalised against each other. Not independently. Together. Whichever term has the single highest point across the whole comparison gets the 100, and everything else is scaled relative to that.
Which means the numbers you get for a keyword depend on what else you put in the query. Here is that effect with actual code:
python
from pytrends.request import TrendReq

pytrends = TrendReq(hl='en-US')

# Query one: bitcoin on its own
pytrends.build_payload(['bitcoin'], timeframe='today 12-m', geo='US')
solo = pytrends.interest_over_time()

# Query two: bitcoin next to a much larger everyday term
pytrends.build_payload(['bitcoin', 'weather'], timeframe='today 12-m', geo='US')
compared = pytrends.interest_over_time()

print("bitcoin alone, peak value:", solo['bitcoin'].max())
print("bitcoin vs weather, peak value:", compared['bitcoin'].max())
In the first query bitcoin peaks at 100, because on its own it is the biggest thing in its own chart. In the second query it collapses to something far lower, because "weather" is an enormous, steady, everyday search term and it takes the 100. Bitcoin did not become less popular between those two lines of code. You just changed what it was being measured against.
This has two practical implications and they both matter.
First, you cannot stitch separate Trends queries together. If you pull keyword A in one call and keyword B in another, those two 0-100 scales are unrelated. Comparing them is meaningless. If you want terms compared, they have to be in the same query, which caps you at five terms per comparison and forces you into chained-comparison tricks if you need more.
Second, the number itself is not the insight. The shape is. A rise from 20 to 60 over three weeks tells you something real about direction and momentum. The literal value 60 tells you almost nothing on its own. Anyone presenting Trends data as if it were volume is either confused or being sloppy, and if you build a dashboard that labels a Trends value "searches" you will eventually have to explain to someone why it is wrong.
There is also a floor effect worth knowing. Low-volume terms return zeros, and a zero does not mean nobody searched for it. It means the volume was below the threshold Google reports. Niche keywords look dead in Trends when they are simply small, which is why Trends is a poor tool for long-tail keyword research and a good tool for watching things that already have real momentum. Google's own Trends help documentation covers the basics of this if you want it from the source.
Get all of that straight and you will use Trends better than most people using it, whichever tool you pull it with.
pytrends, honestly
For roughly a decade pytrends was the answer. If you wanted Trends data in Python, you installed pytrends. It has been in tutorials, university courses, dissertations, dashboards and production pipelines. Something like two hundred thousand people a month were using it.
It worked by talking to the same internal endpoints the Trends website uses. Not a public API, just the undocumented URLs behind the interface. You built a payload, it fetched, it parsed, you got a pandas DataFrame back. The interface was pleasant:
python
from pytrends.request import TrendReq

pytrends = TrendReq(hl='en-US', tz=360)
pytrends.build_payload(
    kw_list=['bitcoin', 'ethereum'],
    timeframe='today 12-m',
    geo='US',
)

interest = pytrends.interest_over_time()
related = pytrends.related_queries()
by_region = pytrends.interest_by_region()
Interest over time, interest by region, related and rising queries, trending searches, keyword suggestions. All of it in a few lines, returning DataFrames you could immediately plot or merge. For exploratory work it was genuinely lovely.
The problems were structural from the beginning, and they were the same problems any unofficial wrapper has. It depended on endpoints Google never promised to keep stable, so whenever Google changed something internally, pytrends broke and stayed broken until a maintainer shipped a fix. And it got rate limited hard. Anyone who used it at any real volume knows the 429 rhythm intimately. Works fine, then a wall of Too Many Requests, then you add sleeps, then it works again, then it breaks differently.
Then in February 2025 the maintainer opened an issue titled "Stepping out as a maintainer", explaining honestly that life had moved on and apologising for the long silence. On 17 April 2025 the repository was archived by its owner. Read-only. Open issues frozen in place, including ones describing breakages with no resolution.
I want to be fair here rather than dance on its grave, because there is a version of this post that dismisses pytrends to sell you something and that would be dishonest.
pytrends still installs. It still works for plenty of queries. If you are a student running an analysis, a researcher pulling a dataset once, or someone checking a dozen keywords a month for your own curiosity, pytrends is fine and you should just use it. It costs nothing, the API is comfortable, and the fact that nobody is maintaining it matters very little when your entire usage is forty requests.
Where it stops being fine is the moment anything depends on it. An archived library means that when Google next changes an endpoint, and Google will, there is no fix coming. Not late. Not ever. Whatever you built stops working and the repair job is now yours. That is an acceptable risk for a notebook and an unacceptable one for anything with a user or a deadline attached.
The community did respond, which is the good news. trendspyg is a maintained successor built explicitly to replace archived pytrends, covering trending now, interest over time, related queries and interest by region, with multi-keyword comparison on a shared scale. It is worth a look if you want to stay in the free-library world. Just go in knowing it inherits the same fundamental fragility, because it is reading the same undocumented endpoints. A maintained wrapper around an unstable foundation is better than an unmaintained one. It is not the same thing as a stable foundation.
What about Keyword Planner?
People suggest Google Keyword Planner as the alternative, and it is worth explaining why it is a different tool rather than a substitute.
Keyword Planner does give you volume, which is exactly the thing Trends withholds. That sounds like an upgrade until you look at the details. You need a Google Ads account, and if you are not actively spending money on ads, the numbers you get are broad buckets rather than precise figures. Something like ten thousand to a hundred thousand a month, which is a range wide enough to be nearly useless for comparing two similar keywords. Spend real money and the granularity improves.
More importantly it answers a different question. Keyword Planner tells you roughly how many people search a term in a month. Trends tells you how interest in that term is moving over time, where it is concentrated, and what is rising alongside it. If you are sizing a market, Keyword Planner. If you are timing content or spotting something taking off, Trends. Teams that need both use both, and they are not interchangeable.
The other quiet limitation is freshness. Trends is close to real time, which is the entire point for anything trend-driven. Keyword Planner works on monthly averages, which is fine for planning and hopeless for catching a spike while it is still a spike.
Why scraping Trends yourself is harder than it looks
The obvious response to all of this is to skip the libraries and hit the endpoints yourself. People try. It goes badly more often than not, and it is worth knowing why before you spend a weekend on it.
Rate limiting is aggressive and it is not generous. Trends is not a public API and Google does not treat automated traffic to it kindly. You will hit 429s far sooner than you expect, and the practical throughput from a single IP is low enough that any real workload needs proxies. Once you need proxies you have a proxy bill, a rotation strategy and a new class of problem.
The request shape is fiddly. Getting Trends data out of the internal endpoints is a multi-step dance involving a token from one request that you then use in another, with parameters encoded in a particular way. It is not one clean GET. When Google adjusts any part of that flow, and there is no reason for them not to, your implementation breaks with no warning and no changelog.
Then there is silent failure, which is the one that really costs you. A rate-limited or malformed Trends request does not always announce itself. Sometimes you get a response that parses fine and contains nothing useful. If your monitoring only checks that a request completed, you can feed empty or partial data into a dashboard for weeks before anyone notices the chart looks wrong.
None of this is impossible. It is just a maintenance commitment, and the question is whether the thing you are building justifies owning that commitment permanently.
The maintained option
If you have got this far and concluded that you need Trends data reliably, on a schedule, without owning the breakage, that is what ScrapeBadger's Google Trends API is for. Structured JSON, the request shape and rate limiting handled, proxies handled, and someone else patching it when Google changes something.
python
from scrapebadger import ScrapeBadger

client = ScrapeBadger(api_key="your_key")

result = client.google.trends_interest(
    q="bitcoin",
    geo="US",
    timeframe="today 12-m",
)

for point in result["interest_over_time"]:
    print(point["date"], point["value"])
Now the honest part, because I would rather you make the right call than the flattering one.
If you need ten queries a month, do not pay for this. Install pytrends or trendspyg, run your queries, get on with your life. A maintained API solves a maintenance problem, and if you do not have a maintenance problem you are buying a solution to something that is not happening to you. I would genuinely rather you used the free library and remembered us later than paid for something you did not need.
It becomes worth it when Trends data feeds something that other people depend on. A dashboard your team checks. A monitoring system that alerts. A client report that goes out weekly. A product feature. In those situations the cost is not the subscription, it is the Tuesday afternoon where the pipeline is dead, nobody knows why, and the fix is in a library that nobody has maintained since April 2025. That afternoon costs more than the API does.
If you want the tool-by-tool version of this decision rather than the conceptual one, we have a comparison of every Google Trends scraper tested honestly, which goes deeper on the options than this post does.
FAQ
Does Google Trends have an official API?
Yes, announced on 24 July 2025, but it is an application-gated alpha rather than a generally available product. You apply and join a queue, access opens to a limited number of developers on a rolling basis, and there is no self-serve signup. Nearly a year on it is still alpha, so plan as though you do not have it and treat getting in as a bonus.
Is pytrends still working in 2026?
It still installs and many queries still work, but the repository was archived on 17 April 2025 and is read-only. Nobody is shipping fixes. It is fine for one-off analysis, notebooks and small personal projects. It is a bad foundation for anything in production, because the next time Google changes an internal endpoint there is no maintainer to respond.
What is the best pytrends alternative?
For staying free and in Python, trendspyg is the maintained community successor and covers the same core data types. For anything that needs to keep working without you babysitting it, a maintained commercial API makes more sense. Choose based on whether a broken pipeline is an inconvenience or a problem.
Why do my Google Trends numbers change when I add another keyword?
Because terms in a single query are normalised against each other. The highest point across the whole comparison gets 100 and everything else is scaled relative to it, so adding a bigger keyword pushes your original term's numbers down. Nothing changed in reality, only the reference point. This is also why you cannot compare values pulled in separate queries.
Is Google Trends data the same as search volume?
No, and this is the most common misunderstanding. Trends gives relative interest from 0 to 100, normalised to the peak within your selected time range and region. It is not a count of searches. For volume estimates you need Keyword Planner or a third-party keyword tool, and those give ranges rather than exact figures unless you are spending on Ads.
How do I scrape Google Trends with Python?
You can use trendspyg or archived pytrends for light work, or hit the internal endpoints directly if you are comfortable with a multi-step token flow and want to own the maintenance. Expect aggressive rate limiting, plan for proxies at any volume, and monitor for silent failures where a request succeeds but returns nothing useful.
Can I get more than five keywords in one comparison?
Not in a single query. Trends caps comparisons at five terms. The standard workaround is chained comparison, where you include one shared anchor keyword in every batch and rescale the other results against it afterwards. It works, but errors compound across batches, so keep the anchor sensible and do not chain more batches than you need.

Written by
Domas Sakavickas
Dom Sakavickas is Co-founder of ScrapeBadger, building web scraping infrastructure for developers and data teams. He writes about the web data market, tool comparisons, and business use cases for scraping. ScrapeBadger is a web scraping API platform specialising in Twitter/X, Reddit and Google data, with dedicated scrapers also covering TikTok, YouTube, LinkedIn, Amazon, eBay, Zillow and 40+ more: with built-in anti-bot bypass and an MCP server for AI agents.
Ready to get started?
Join thousands of developers using ScrapeBadger for their data needs.