How to Track Italian Property Prices With Immobiliare.it Data
 Domas Sakavickas
AI Summary: This guide shows how to track Italian property prices using Immobiliare.it data, illustrating with 2026 figures the 7.5-times price spread between cities like Bolzano and Caltanissetta and how systematic scraping reveals regional shifts such as Florence overtaking Rome.
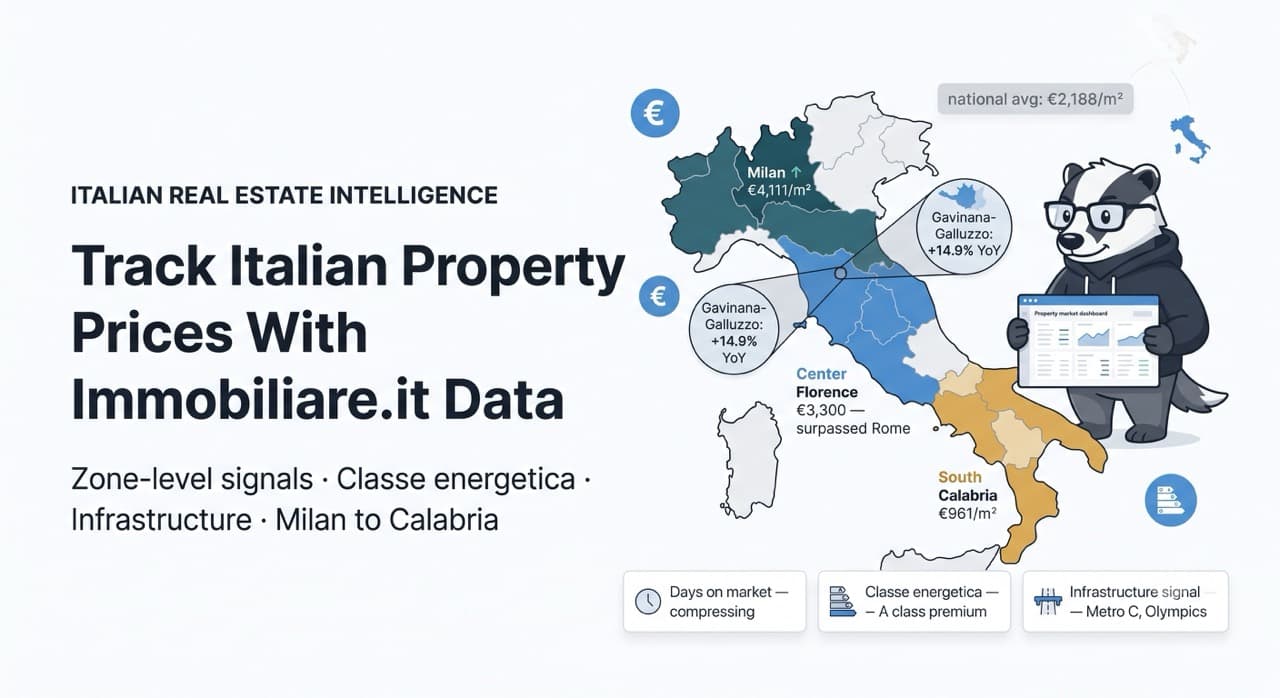
The cheapest provincial capital in Italy is Caltanissetta, in Sicily. In 2026, the average asking price there is approximately €635 per square metre. The most expensive city is Bolzano, in the Alps, at around €4,770 per square metre. That is a 7.5-times price difference between two places inside the same country, under the same legal system, with the same currency.
Milan comes second at €4,111 per square metre. Florence — which has now surpassed Rome in price per square metre, a shift most observers have not yet registered — is running at approximately €3,300 per square metre and is forecast for 7.1% growth in 2026. Rome itself, despite being the capital, averages around €2,500 per square metre across Lazio, with central properties exceeding €8,000. And Calabria, the toe of the Italian boot, averaged €961 per square metre across the entire region in June 2026.
The national average — €2,188 per square metre, up 4.24% year-on-year in April 2026, published directly by Immobiliare.it from their own listing data — describes a market that does not exist anywhere in the country. Italy's property market is not a national market. It is a collection of city markets, neighbourhood markets, and micro-market dynamics so divergent that tracking price data at anything above the municipal or zone level produces intelligence that is too blurred to act on.
Immobiliare.it is Italy's leading residential property portal, and unlike Immobiliare's published market reports — which provide useful national and regional context but too little granularity for investment or development decisions — the underlying listing data contains the barrio-level signal that actually drives those decisions. This guide covers the five specific signals that matter for Italian property price tracking, and how ScrapeBadger's Immobiliare.it Scraper gives you systematic access to them.
Why Immobiliare.it Is the Right Data Source
Italy has several property portals. Idealista covers Italy as part of its Spain-Italy-Portugal Southern European footprint. Casa.it, Subito.it, and Trovacasa are also active. Immobiliare.it is the dominant player — and specifically for Italian market intelligence, the data quality and structural richness makes it the right starting point.
The field set per listing is unusually complete for a European portal. Listing price and asking price history are present. Surface area and price per square metre are structured and consistent. The Italian energy class system — classe energetica, from A4 (best) to G (worst) — is a structured, searchable field rather than a free-text note. The micro/macrozone classification system, which is Italy's own property zone taxonomy, is embedded in listings at a granularity that goes well beyond what most European portals provide. GPS coordinates, listing dates, days on market, floor number, amenity flags (ascensore, box auto, terrazzo, giardino, piscina, portineria), agency contact data, and the distinction between residential sale, rental, new build, and auction listings are all present.
Immobiliare.it publishes its own market data reports, and these are cited across the research industry — Global Property Guide, Investropa, IRECOM, and The Local all reference Immobiliare.it's index figures. The portal's data is treated as the leading real estate price index for Italy by researchers and institutional investors. The figures in this article are drawn from those published reports and from Immobiliare.it's own market data page as of June 2026.
What the published reports do not provide, and what listing-level data collection enables, is the microzone-level analysis. Immobiliare.it's market data page shows regional and city averages. The underlying listing data shows specific neighbourhoods, specific zones, specific building types. The difference between a city average and a microzone trend is the difference between "Rome is up 5%" and "Parioli and Prenestino are up more than 8% while Pigneto is being driven by the Metro C development corridor."
The Five Signals That Matter for Italian Market Tracking
Signal 1: Price-Per-Square-Metre Velocity by Zone, Not City Average
The national average of €2,188 per square metre tells you where Italy sits globally. The velocity of change in a specific zone — is the price per square metre accelerating, flat, or compressing? — tells you something actionable.
The methodology: collect all active listings for a specific Italian municipality or zone over a trailing 30, 60, and 90-day window. Calculate the median and distribution of price per square metre across observations. Compare the 30-day median to the 90-day median. An area where the 30-day median is materially higher than the 90-day median is in acceleration. An area where the distributions are identical is stable. An area where the 30-day median is lower than the 90-day median is softening.
This velocity calculation at the zone level is not available from any published index. Immobiliare.it's own market page provides monthly averages by region and major city. The microzone velocity signal requires collecting listing data at frequency — weekly or fortnightly — and building the time series yourself.
Italy's fastest-moving zones in early 2026 make this concrete. Florence's Gavinana-Galluzzo neighbourhood is up 14.9% year-on-year — the fastest-rising neighbourhood in Italy. Bologna's San Donato-Fiera is up 11.8%. Milan's Centro Storico is up 10.3%. Bologna's Santa Viola is running at 10.1%. These are neighbourhood-level figures derived from listing data, not from city averages. None of them would be visible in a national or regional price index.
More importantly: if you are three months into monitoring these zones and the velocity is starting to slow — if the 30-day median is returning to the 90-day median after a period of acceleration — that is an early signal of peak that published reports will confirm six months after the fact.
Signal 2: Days on Market Compression
Italian real estate is characterised by a notable asking-to-sold gap: the average sale-to-asking price ratio in Italy as of 2026 is approximately 92–94%, meaning the typical home sells at 6–8% below the first asking price. This negotiation gap is built into the market's expectations and is much larger than equivalent gaps in the UK or Germany.
What the asking-to-sold ratio does not tell you is how long properties are spending on the market before they transact. Days on market compression — when properties that were typically sitting for 90 days start moving in 60, then 45, then 30 — is the leading signal of accelerating buyer urgency. It precedes price acceleration. Sellers observe that properties are moving faster and begin revising their asking prices upward.
Immobiliare.it's listing data contains the listing date for each property. Tracking when a listing moves from active to sold or inactive — and how many days elapsed — produces the days-on-market distribution for a zone. When this distribution is compressing over successive observation windows, that zone is in the early phase of a demand surge.
The opposite signal — listing dates extending, properties sitting longer than recent history — is an early warning of softening before any price index confirms it. In the Italian context, where published price data has longer publication lags than the UK or US, this real-time days-on-market signal from listing data is particularly valuable.
Signal 3: New Listing Velocity and Price at Entry
New listings entering the market at higher per-square-metre prices than the existing stock is the most direct evidence of seller confidence. A seller who enters the market today at €3,500 per square metre in a zone where recent listings have averaged €3,200 is testing whether the market will support a higher price. The absorption rate of those higher-priced new listings — do they sell, and how quickly? — validates or refutes the test.
Tracking the price at entry for new listings in a zone, compared to the existing stock's price distribution, reveals this confidence signal before it shows up in transaction data. Italian sellers typically list slightly above where they expect to transact, given the 6–8% negotiation gap built into the market. When the entry price for new listings in a zone is rising while the gap between entry price and previous comparable sale prices is also widening, sellers are increasingly optimistic — and the zone's price momentum has further to run.
The reverse pattern — new listings entering at lower per-square-metre prices than the existing stock — signals seller hesitation or awareness that the market is not supporting current prices. In rapidly rising city markets like Milan and Bologna, this signal has been absent for most of the past three years. In secondary cities and Southern markets, it appears periodically and provides early warning of price stagnation before it becomes visible in transaction data.
Signal 4: Classe Energetica Premium and the Energy Class Discount
Italy's mandatory energy class system runs from A4 (most efficient) through A3, A2, A1, B, C, D, E, F, and G. Since the EU's Energy Performance of Buildings Directive has been driving progressive upgrade requirements across Europe, energy class is an increasingly important pricing variable in Italian real estate.
The specific Italian dynamic in 2026: properties that received Superbonus 110% renovations in 2021–2023 — the Italian government's programme that allowed up to 110% tax credit for energy renovation costs — have typically upgraded from G or F class to A or B class. These properties are now commanding measurable price premiums over comparable unrenovated properties with low energy class ratings.
The size of this premium varies by market. In Milan, where buyers are sophisticated and credit-sensitive, the energy class premium is substantial and well-documented by agents. In secondary Southern markets, where buyers are more price-focused and renovation norms are less established, the energy class premium is smaller but present.
Collecting Immobiliare.it listing data with the classe energetica field allows you to calculate this premium at the zone level: what is the price-per-square-metre differential between A and B class properties and E, F, and G class properties in the same zone, same property type, and similar surface area? This differential represents the current market valuation of energy efficiency in that specific location.
For buyers evaluating whether to renovate before sale, for developers assessing the business case for energy upgrades before listing, and for investment funds comparing assets on an energy-adjusted basis, this locally-calculated premium is more useful than any national benchmark.
Signal 5: Auction Listings as Market Stress Indicators
Italy's judicial auction (asta giudiziaria) system is one of the most developed in Europe, and Immobiliare.it covers auction listings as a distinct property type alongside regular sale listings. The volume and geographic distribution of auction listings — foreclosed and court-mandated sale properties — is an underused market signal.
A rising proportion of auction listings in a specific zone relative to total listings signals financial stress among property owners in that zone, which often precedes broader price pressure. A falling proportion signals improving owner financial resilience. In the Italian context, where debt restructuring has historically been slow and court proceedings long, an increase in auction listing volume in a zone often reflects economic pressure that accumulated 18–36 months earlier.
Auction properties in Italy typically list at significant discounts to market — often 20–40% below comparable non-auction properties — which attracts investors and produces transaction data at the distressed end of the market. Tracking this separately from the main market avoids the analytical distortion of mixing auction transactions with normal market activity.
The North-South Divergence: Where the Intelligence Opportunity Lives
The most important structural characteristic of the Italian property market for any intelligence operation is the regional divergence. Italy is not one market. The data makes this explicit.
The Northeast recorded price growth of 4.74% in 2025. The Northwest 4.41%. Central Italy 3.68%. The South and Islands 3.00%. And within those regional averages, new build performance diverged sharply from existing stock — with new-home prices in Central Italy and the South actually declining in Q4 2025 even as overall prices rose.
But the divergence is not simply North good, South bad. Naples in 2025 and 2026 is an interesting counter-narrative: a city where prices remain significantly below Milan and Rome while fundamentals are improving through infrastructure investment, a young demographic profile, and tourism growth. The gross rental yield in Catania is 9.17% and in Palermo 8.25% — the highest among Italy's major cities — precisely because sale prices are low relative to rental demand. For yield-focused investors, the intelligence case for the South is not sentimental — it is numerical.
What the Immobiliare.it data enables is evaluating these opportunities not at the regional level but at the zone level within cities. Naples has significant internal variation: Poggioreale-Vicaria was the fastest-rising Naples neighbourhood in early 2026 at +9.3% year-on-year. Certain zones of Palermo have shown consistent absorption rate compression while the city's headline average remained flat. The city-level report misses this. The listing-level data captures it.
Infrastructure as a Leading Indicator
One signal that requires combining Immobiliare.it listing data with public infrastructure information is the connectivity premium: the price appreciation that occurs in areas gaining new transit connections or major regeneration investment.
In 2026, the infrastructure development driving Italian real estate demand most clearly is:
Milan Porta Romana and Santa Giulia. The 2026 Winter Olympics (Milano Cortina 2026) legacy investment is landing in these districts. The Olympic Village and rail yard regeneration projects are adding amenity to areas that were industrial or underserved within a prime city. Listing-level Immobiliare.it data for Porta Romana and Santa Giulia shows days-on-market compression that began before the headline coverage of the Olympics infrastructure confirmed the trend.
Rome Pigneto and Metro C extension. The Metro C line is Rome's longest-running infrastructure project, and the stations that opened between 2020 and 2025 produced measurable price appreciation in surrounding zones within 18 months of opening. The upcoming Pigneto interchange — connecting Metro C to the Casilina rail line — is the next step, and the zone around Pigneto has been showing the early listing velocity signals of pre-opening infrastructure premium for the past 18 months.
Naples Linea 6 and Bagnoli. Naples' Linea 6 western metro extension and the Bagnoli waterfront regeneration project are the two infrastructure anchors for western Naples. Bagnoli specifically — a former industrial waterfront — is an area where early-phase listing data shows new listings appearing at prices that represent a significant premium to the zone's historical average, driven by developer and early-investor activity ahead of the broader regeneration.
Bologna Red Tramway Line. Bologna is already one of Italy's fastest-growing property markets at +6.5% city-wide in early 2026. The Red Tramway corridor adds a zone-specific signal within that city: the areas along the tram route are absorbing listings faster than the city average, particularly in zones like San Donato-Fiera, which is already showing +11.8% year-on-year.
Cross-referencing infrastructure project timelines against Immobiliare.it listing velocity by zone — are days-on-market compressing in the affected area? Are new listings appearing at higher entry prices? — reveals whether a zone has already begun pricing in the infrastructure development or whether the opportunity window is still open.
Combining Immobiliare.it With Complementary Data Sources
Immobiliare.it data at the listing level is the primary source for Italian residential market intelligence. The signals it cannot provide directly — demand-side search interest, rental yield cross-validation, qualitative neighbourhood sentiment — come from complementary sources.
Google Trends for property search terms in Italian. ScrapeBadger's Google Trends API returns search interest over time for any keyword and geography. Tracking interest for terms like "affitto [city name]" (rental + city) and "acquisto casa [neighbourhood]" (home purchase + neighbourhood) against Immobiliare.it listing velocity in the same area provides a demand-supply signal: are more people searching for property in an area than there are listings available, or is the reverse true?
Google Maps for neighbourhood amenity density. ScrapeBadger's Google Maps API returns the business category distribution for any geographic area. The density of cafés, restaurants, coworking spaces, and boutiques in a neighbourhood is a proxy for the amenity profile that drives residential desirability — and this data is available before any price signal reflects it.
Idealista Italy as cross-reference. ScrapeBadger's Idealista Scraper covers Italy as well as Spain and Portugal. Running the same zone-level analysis on Idealista alongside Immobiliare.it provides a cross-platform validation for price signals: a zone showing consistent asking price acceleration on both platforms simultaneously is a stronger signal than acceleration on one with stability on the other.
All of this runs under the same ScrapeBadger API key with unified billing and zero credits charged for failed requests.
What Immobiliare.it Data Cannot Tell You
Listed prices are asking prices, not transaction prices. The Italian 92–94% sale-to-asking ratio means the Immobiliare.it data systematically overstates transaction prices by approximately 6–8%. For investment analysis that requires actual transaction values, the Osservatorio del Mercato Immobiliare (OMI) of Italy's Revenue Agency publishes transaction-based price ranges by zone — the same micro/macrozone taxonomy that Immobiliare.it uses — with a quarterly publication lag. Combining OMI transaction data with Immobiliare.it asking price data produces the most complete Italian market picture available.
Auction property pricing is structurally distinct from market pricing and should be tracked separately. Mixing auction listing data with standard market listings distorts both the price per square metre calculation and the days-on-market analysis.
New build pricing follows different dynamics from existing stock — as confirmed by the 2025 Italian data showing new build prices declining in the South even as existing stock rose. The classe energetica field helps distinguish these segments if it is used as a filter alongside property type.
Putting It Into Practice
The practical workflow for systematic Italian property price tracking:
Weekly collection of Immobiliare.it listings by target zone or municipality — both sale and rental — using ScrapeBadger's Immobiliare.it Scraper. Storage of each observation as a time series data point: price, price per square metre, listing date, classe energetica, zone classification, property type, floor, surface area.
Monthly calculation of the five signals described above for each tracked zone: price velocity, days-on-market distribution, new listing entry price distribution, energy class premium differential, and auction proportion.
Quarterly cross-reference against OMI transaction data for the same zones — aligning the asking price trend from Immobiliare.it against the transaction price range from the official register to maintain calibration on the negotiation gap.
Ad hoc infrastructure event monitoring: when a project milestone is announced — a tram line opening, a regeneration zone designation, a metro station confirmed — immediate collection of listing data for the surrounding zones to establish the pre-event baseline before the market begins pricing the news in.
Free trial at scrapebadger.com/immobiliare-scraper — 1,000 credits, no credit card required. Full documentation at docs.scrapebadger.com.
FAQ
Does Immobiliare.it have a public API?
No. Immobiliare.it does not offer a public API for listing data. The platform's own market data publications are available on their website as aggregated reports, but programmatic access to individual listing data requires scraping. ScrapeBadger's Immobiliare.it Scraper provides the structured listing data endpoint that the platform itself does not offer.
What makes Immobiliare.it different from Idealista for Italian market intelligence?
Both cover Italian residential property. Immobiliare.it is Italy-specific and Italy-dominant — it has deeper penetration in Italian secondary cities and provinces, more complete auction coverage, and higher listing volumes in regions outside the major urban centres. Idealista covers Italy as part of its Southern European footprint and is particularly strong in urban prime markets. For comprehensive Italian national coverage including secondary cities and Southern Italy, Immobiliare.it is the primary source. For cross-country comparison between Italian markets and the Spanish or Portuguese markets also covered by ScrapeBadger's Idealista scraper, Idealista provides the consistent methodology across markets.
How does Italy's classe energetica system compare to France's DPE system?
Both use an A-to-G classification. France's DPE system is currently driving direct market impact through rental bans: G-rated properties have been banned from new rental contracts in France since January 2025, with F following in 2028. Italy's energy performance regulations have not yet imposed equivalent rental bans, though the EU's recast Energy Performance of Buildings Directive creates long-term pressure toward the same direction. In Italy in 2026, the energy class premium is a pricing signal rather than a compliance imperative — buyers and investors price it, but it does not yet create the hard segmentation that France's DPE is producing.
Why has Florence surpassed Rome in price per square metre?
Florence's supply is structurally constrained: the historic centre has UNESCO heritage protection that limits new build and significantly restricts renovation in ways that Rome's larger and more varied urban fabric does not. At the same time, Florence receives consistent demand from both international buyers (US, UK, German second-home and lifestyle buyers) and domestic Italian professionals relocating from Milan who want proximity to cultural amenity with lower prices. The city's small size means demand concentrations in the best zones push the overall city average upward faster than in Rome, where the total stock is far larger. In February 2026, Florence's average was approximately 70% above the national average, while Rome was only 12% above.
What is the OMI and how does it complement Immobiliare.it data?
The Osservatorio del Mercato Immobiliare (OMI) is the Italian Revenue Agency's real estate market observatory. It publishes semi-annual transaction-based price ranges by micro/macrozone — the same granular geographic taxonomy that Immobiliare.it uses in its listings. OMI data reflects actual registered transaction values, not asking prices, so it captures the real clearing price after negotiation. Combined with Immobiliare.it's real-time asking price data, the OMI provides the transaction baseline against which to calibrate the 6–8% negotiation gap for each specific zone.

Written by
Domas Sakavickas
Dom Sakavickas is Co-founder of ScrapeBadger, building web scraping infrastructure for developers and data teams. He writes about the web data market, tool comparisons, and business use cases for scraping. ScrapeBadger is a web scraping API platform specialising in Twitter/X, Reddit and Google data, with dedicated scrapers also covering TikTok, YouTube, LinkedIn, Amazon, eBay, Zillow and 40+ more: with built-in anti-bot bypass and an MCP server for AI agents.
Ready to get started?
Join thousands of developers using ScrapeBadger for their data needs.